U.S. Household Commuting Dataset and Transportation Fairness (under review), Hao Hao, Hai Wang, Peter Zhang.
Efficient and fair transportation planning creates opportunities and equity for jobs, health care, and education. Therefore, data consolidation for transportation systems provides basis for evidence based policies. In this work, we construct a dataset that documents home-to-job commuting time and distance information for the 100 most populated U.S. urban areas. Our dataset builds on the U.S. Census Bureau's Longitudinal Employer-Household Dynamics Dataset, which provides origin (home) and destination (job) location information for households. For these origin-destination (OD) pairs, we derive commuting time and distance information under different travel modes, each a combination of walking, public transit, and ridesourcing. We construct data under different modes so policymakers and researchers have information about alternatives and can perform what-if analysis. Towards the end of this data sheet, we document a sample use case to illustrate this goal.
Each instance in our dataset contains commuting time and distance information for one OD pair. We randomly sampled 100,000 OD pairs from the U.S. Census Longitudinal Employer-Household Dynamics Dataset (1,000 data points each for the 100 most populated urban areas, the list or urban areas with the corresponding indices can be found under metadata/Urban_Area_ID.csv.
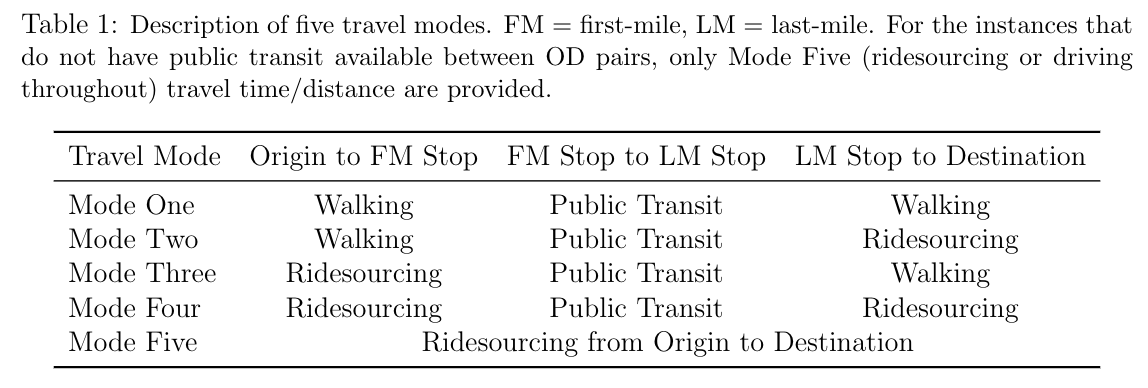
In particular, each instance contains travel time and distance information for five different travel modes, as documented in Table 1.
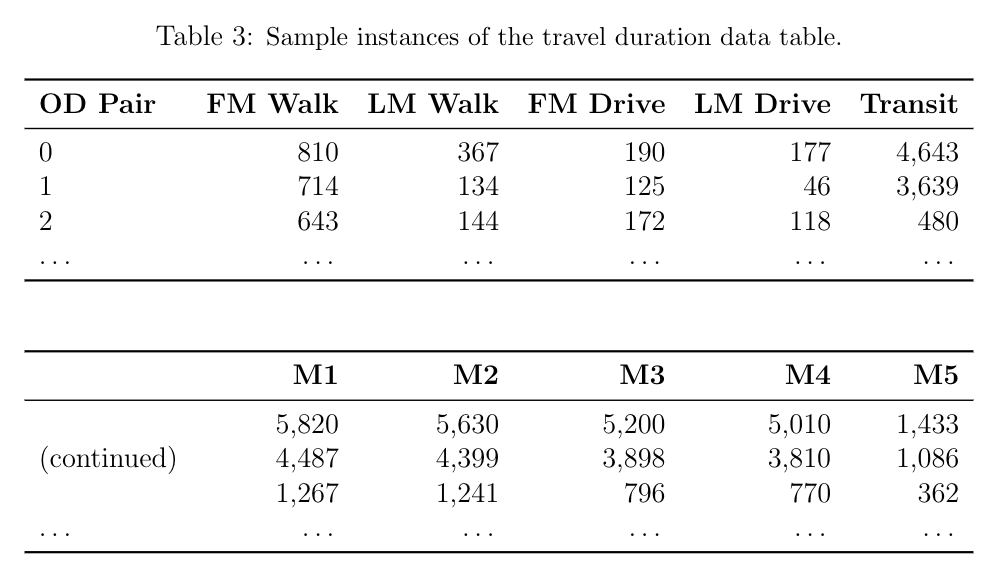
The definition of columns of the dataset is provided in Table 2, with sample instances of the dataset shown in Table 3. The data files are organized as follows: data/duration/Duration_M1M5_{Urban_Area_Index=i}.csv and data/distance/Distance_M1M5_{Urban_Area_Index=i}.csv each contains the travel time and travel duration information of 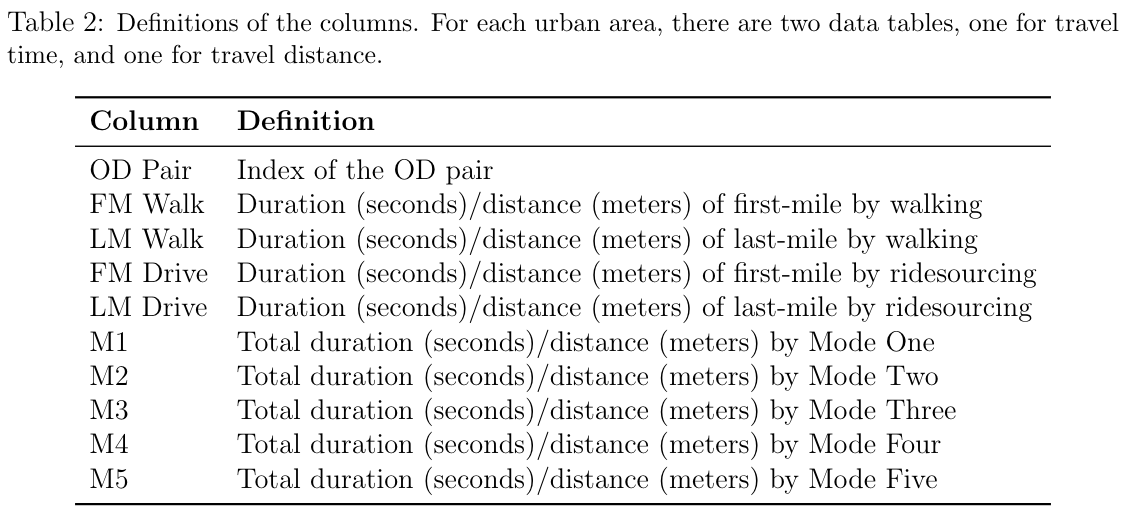
Please refer to the data sheet PDF.
The summary statistics of travel duration/distance across the five travel modes are shownin Tables 4 and 5. The summary statistics for the percentage of OD-pairs with access to public transit within each of the 100 urban areas is documented in Table 6.
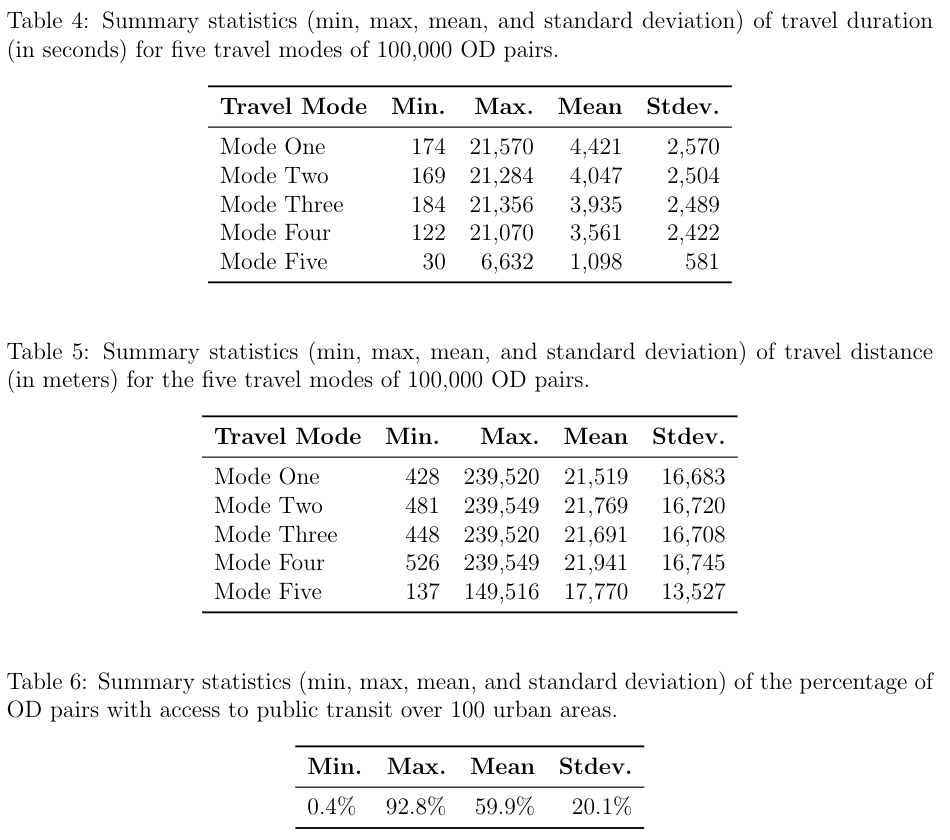
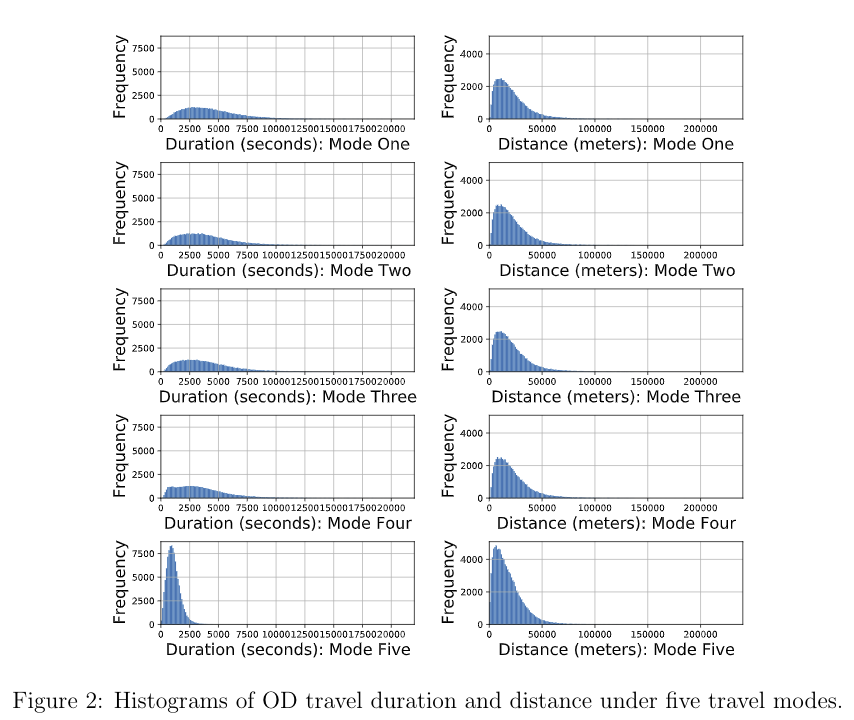
Figure 2 shows the histograms of OD travel duration and distance under five different travel modes.